Infographics & Data Visualization Website
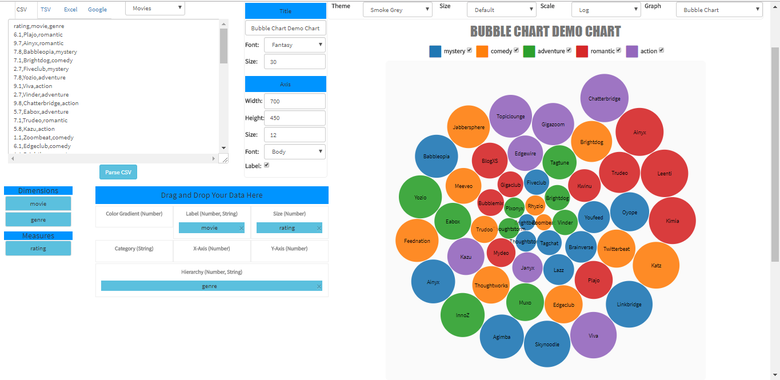
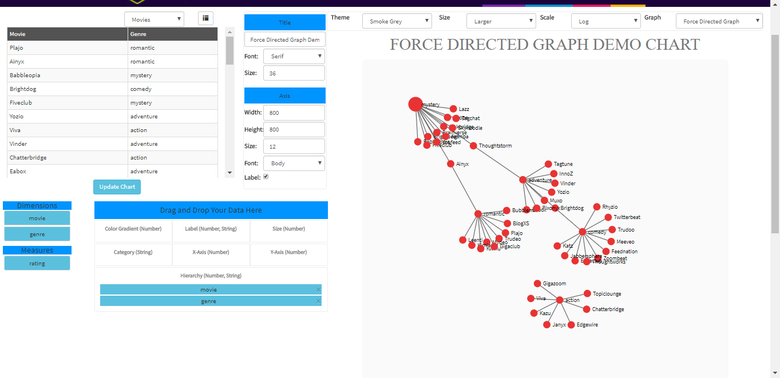
This project is a Web Application mainly focusing to provide users the facility to visualized their data in form of charts. Users of the application can import their data in CSV, TSV or excel format and can select various chart types according to the nature of the data to produce highly reactive custom charts which can be saved to profile or download as picture. Application uses powerful D3.js a JavaScript library to produce custom reactive charts.

About Me
We are client oriented transparent solutions provider. We work in the latest and most trendy technologies used globally. We offer a range of services in the field of Information Technology. We have a team of expert resources with excellent technical skills to convert your every idea into a software reality. We also have an offshore development team in Pakistan working for us.